
NVDA: ~$1T Cumulative Free Cash Flow in 3 Years — CAGR 58.2%
Published · Updated · By Investus editorial desk (SUNRYU Partners)
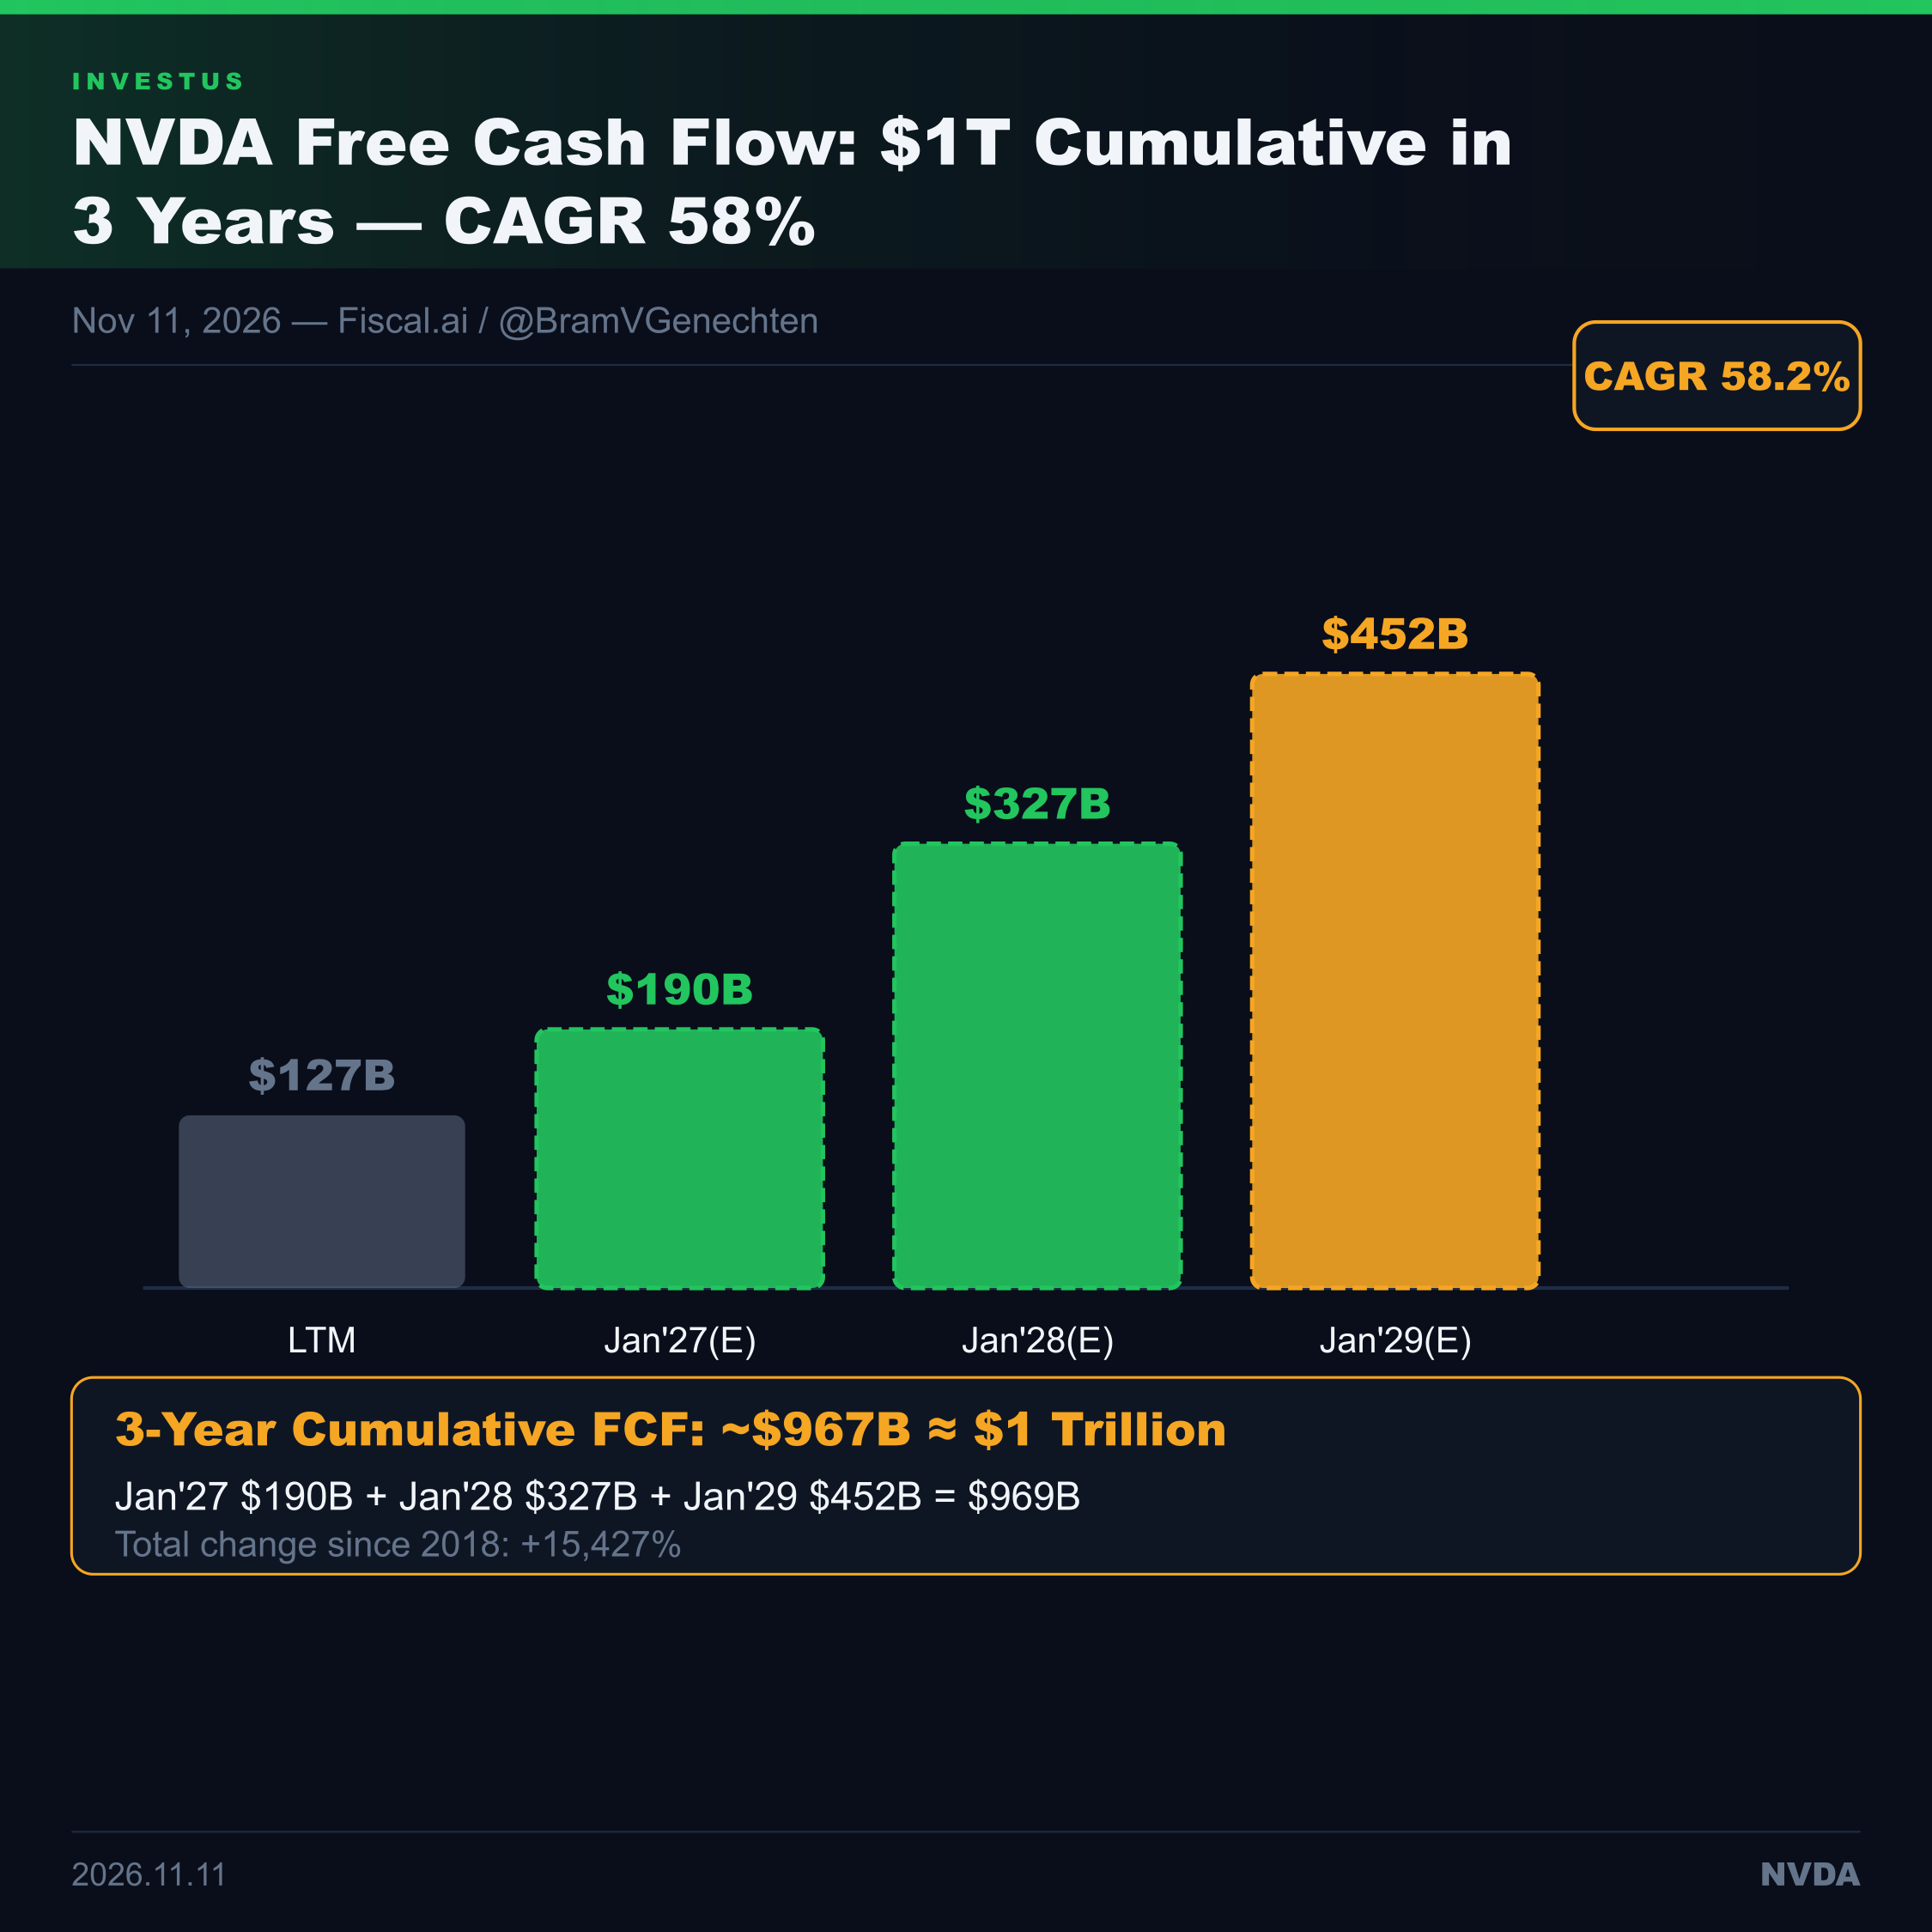
NVIDIA's free cash flow is projected to total approximately $1 trillion over the next three years: Jan'27(E) $190B, Jan'28(E) $327B, Jan'29(E) $452B — CAGR 58.2%. Since 2018, NVDA's FCF has changed +15,427%. The LTM figure is $127B; the Jan'29 estimate is 3.5× that level.
What happened
Fiscal.ai analysis (via @BramVGenechten) projects NVIDIA's annual free cash flow as: Jan'27(E) $190,203M, Jan'28(E) $326,778M, Jan'29(E) $451,669M. Summed over three years: ~$969B ≈ $1 trillion. CAGR: 58.2%. Total change since Jan 2018: +15,427%.
The current LTM FCF is $127B. Jan'29(E) at $452B is approximately 3.5× that level. At this scale, NVDA's annual FCF would exceed the full-year revenue of the majority of S&P 500 companies.
Bram Van Genechten's post: 'Nvidia is expected to do ~1 trillion in Free Cash Flow. In 3 years. In-sane.'
More detail
The projections depend on three things: Blackwell GPU shipments ramping successfully for Jan'27, agentic AI driving 4–10× GPU demand growth in inference (not just training), and TSMC leading-edge capacity remaining sufficient. The FCF margin expansion is partly structural: NVIDIA's software ecosystem (CUDA) and cloud platforms (DGX/HGX) have lower capex requirements than hardware alone, so cash conversion accelerates as the mix shifts.
The LTM chart from 2018 to present shows the inflection point was 2024, with Jan'24 at $27B, Jan'25 at $61B, Jan'26 at $96B, LTM at $127B — and then a forecast steepening to $190/327/452B in the following three years.
Analyst and house views
Susquehanna is bullish ahead of the November 17 NVDA earnings report. BofA maintains Overweight on Blackwell ramp evidence. NVDA's current P/E of 22.9× vs a 10-year average of 61.2× — if the FCF growth path is real, the multiple compression story runs in reverse.
investus Research
Sources & further reading
Related Guides
Related articles
Daily Snapshot 2026.07.15 — IBM Earnings Shock + Top 9
BREAKING IBM Q2 miss −28% · CPI −0.4% · Chamath TSLA~$600 · Robotaxi 765 · GOOGL 1.6GW · TSMC $140B · JPM $16.9B · NFLX $169 · SNDK $3,100 · LCID −41.74%. More in individual reports.
Anthropic's $120.5B SpaceX Compute Deal: What the 90-Day Exit Clause Means After the 'Mid-2027' Report
Anthropic's S-1/A caps SpaceX compute at $120.5B with a 90-day exit after early 2027. What the 'mid-2027' report adds and what remains unconfirmed.
35,578 Open Grok Build Apps: What Claroc Measured and What SpaceXSI Disputes
SpaceXSI's Grok Build: Claroc says 35,578 published apps opened with no sign-in. What was measured, what SpaceXSI disputes, and open questions.
Disclaimer
This article is editorial research for informational purposes only. It is not investment advice, a recommendation, or a solicitation to buy or sell any security, and does not guarantee any return. Markets carry risk of loss. Verify figures against the primary sources before making decisions.